
How to Compare SMS Routes Side by Side: The Metrics That Actually Matter
By Saad ·
Most route comparisons come down to one column in a spreadsheet. Price per SMS.
It's an easy number to compare. It's also the number that tells you the least about whether your messages will arrive.
If you want the best SMS route for a country, you need to look at what happens after you hit send. Here's a practical way to compare SMS routes, metric by metric.
Set Up a Fair Test First
A comparison is only as good as the test behind it. Before you look at any numbers, give every route the same conditions.
Same message content. Same sender ID. Same destination networks. Same time window. Change one thing at a time, or the results won't mean much.
And test on real SIMs on the live network. Results from virtual numbers, or from the vendor's own reports, won't show what customers actually see. That's the foundation of good SMS route testing.
Metric 1: Delivery Ratio
This is the starting point. Out of every message sent, how many actually reached a handset?
Note the word "actually". Your delivery ratio should come from real SIM results, not from receipts. A route can report 99% and deliver 85%.
Measure it per network, not just per country. A route can be excellent on one operator and weak on the next.
Metric 2: Latency
How long does a message take from submission to landing on the phone?
For marketing, a short delay is fine. For OTPs, it isn't. If a code takes two minutes, plenty of users will give up or tap resend, which costs you twice.
Look at average latency, but look at the spread as well. A route that's usually five seconds but sometimes three minutes is less reliable than one that's always ten.
Metric 3: DLR Accuracy
Every route sends back delivery receipts. The question is whether they're true.
Compare each DLR with what happened on the real SIM. If a route reports DELIVRD for messages that never arrived, or returns receipts faster than messages actually land, its reporting can't be trusted.
DLR accuracy matters even when delivery looks fine, because your team uses those reports to make choices. Bad data now leads to bad routing later.
Metric 4: Sender ID Integrity
Did your brand name arrive as sent?
On some routes, the alphanumeric sender ID gets replaced with a random local number. That's often a sign of grey routing, and it hurts trust. People ignore messages from numbers they don't recognise.
Track sender ID integrity as a simple pass or fail on every test.
Metric 5: Content Integrity
Check that the message body arrived exactly as you sent it.
Watch for broken Unicode, missing parts of long messages, links that were cut or changed, and messages split in the wrong place. Content integrity problems are easy to miss when nobody looks at the real handset.
Metric 6: Cost Per Delivered SMS
Now bring price back in. Properly this time.
Take the price per message and divide it by the real delivery ratio. That gives you the cost per delivered SMS, and it often flips the ranking.
Say Route A costs $0.020 per message and delivers 98%. Route B costs $0.015 and delivers 70%.
Route A works out to about $0.0204 per delivered message. Route B works out to about $0.0214. The "cheap" route is the expensive one, and that's before you count failed logins or support tickets.
Metric 7: Route Stability
A route that performs well today might not next week. Vendors change suppliers. Operators update firewalls.
Route stability is about consistency over time. Test across several days and different hours, then see how much the numbers move. Steady and slightly slower usually beats fast and unpredictable.
Putting It All on One Scorecard
Once you have test results, put them in one view. Here's an example of three routes to the same country:
Metric | Route A | Route B | Route C |
|---|---|---|---|
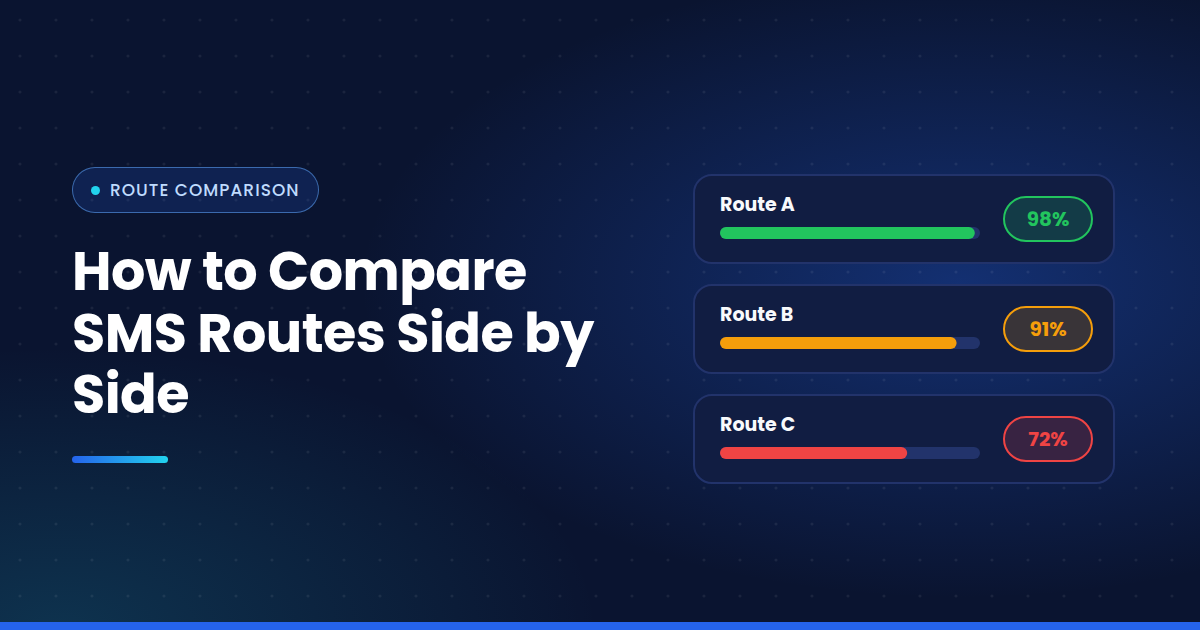
Delivery ratio (real SIM) | 98% | 91% | 72% |
Average latency | 6 sec | 4 sec | 38 sec |
Slowest result | 14 sec | 95 sec | 4 min |
DLR accuracy | High | High | Low |
Sender ID intact | Yes | Yes | No |
Content intact | Yes | Yes | Partly |
Price per SMS | $0.020 | $0.017 | $0.011 |
Cost per delivered SMS | $0.0204 | $0.0187 | $0.0153 |
Route C looks cheapest even after adjusting for delivery. But the sender ID is gone, timing is all over the place and the receipts can't be trusted. For OTPs, it's out.
Route B is faster on average but has worrying spikes. Route A is the safe pick for critical traffic, while Route B could handle marketing, where a short delay won't hurt.
Weight the Metrics for Your Use Case
Not every business needs the same thing. Weight each metric by what you send.
OTPs and login codes: latency and delivery ratio first, then sender ID
Banking and transaction alerts: delivery ratio, sender ID and DLR accuracy
Marketing campaigns: cost per delivered SMS and content integrity
Customer notifications: a balance of all of them
Common Mistakes When Comparing Routes
A few habits skew results more than people expect.
Testing only once. One good result on a quiet morning proves very little.
Testing one network. Covering the biggest operator and calling it done hides problems on the rest.
Trusting receipts alone. If the delivery numbers come from the vendor's DLRs, you're grading the vendor with its own homework.
Changing the message between routes. Different content can trigger different filters, so keep it identical.
How Messeo Makes This Easier
Running a proper SMS route comparison by hand is slow. You need SIMs in every country, a way to send through several vendors, and somewhere to collect it all.
Messeo handles that. It has a physical SIM base in multiple countries, so tests land on real local networks. Send the same message through different routes and compare results side by side, covering delivery, timing, sender ID, content and DLR accuracy.
Its built-in AI analysis also helps flag patterns you might miss, like a route slowly slipping or receipts that stop matching reality.
Final Thoughts
Price is the easiest metric to compare and the least useful on its own. The routes that look cheapest on paper often cost the most once you count what never arrived.
Compare on delivery, speed, honesty and consistency first. Then look at price.
That's how you pick routes that actually protect your business.